Funding rate arbitrage risks: 6 ways the spread fails
Funding rate arbitrage risks include a changing spread, sign flips, fees, slippage, thin liquidity, mismatched settlement intervals and venue-specific failures. Opposite LONG and SHORT legs can reduce directional price exposure, but they do not guarantee the projected funding income. Every layer must remain measurable and usable long enough for funding transfers to exceed the full round-trip cost.
The cases below use PerpRadar measurements from July 10, 2026, 15:58–16:08 UTC. They illustrate failure modes, not current setups.
Why funding rate arbitrage is not risk-free
A cross-venue funding setup offsets much of the directional price exposure by carrying opposite legs on two venues. That hedge does not lock the funding spread, the entry price, the exit price or access to either venue. The result is a relative-value setup with several moving parts, not a guaranteed arbitrage.
The useful question is not “which row has the largest APY?” It is “which assumptions must remain true long enough for transfers to exceed every cost and failure mode?”
1. Rate and sign-flip risk
The spread can narrow or reverse before costs are recovered. On July 10, an S pairing showed 98.9% annualized on the funding table, yet its 24-hour history contained 14 sign flips and ranged from −156% to +194%. Three minutes after the table capture, the same pairing showed 170%.
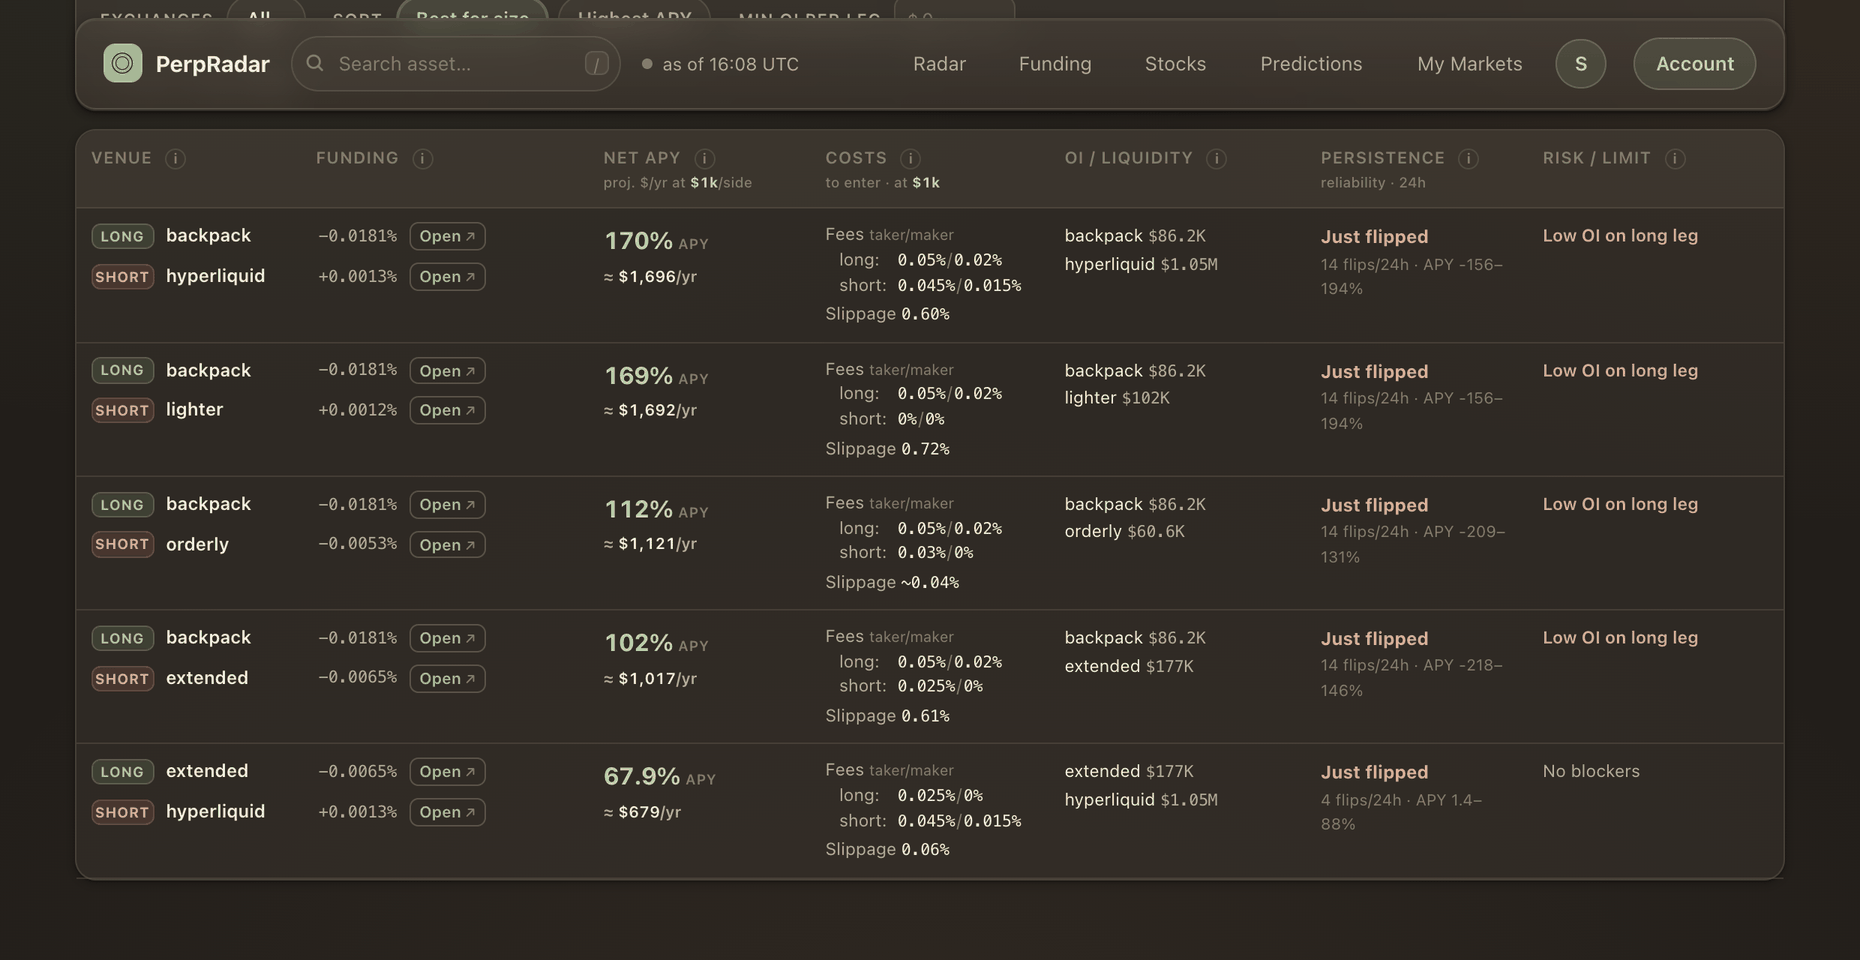
A current spread is one observation. The S market page adds the missing path: how often direction changed and how wide the recent range became.
2. Spread, fee and slippage risk
Both legs have an entry and an exit. The HYPE case combined a −0.0241% hourly print with a 1.66% spread on the thin Bluefin market. At roughly 0.58% funding per day, crossing that spread in and out represented about three days of transfers — if the rate stayed unchanged.
The cost is specific to size. A $1,000 depth walk and a $10,000 depth walk can produce different slippage, so a small headline fee is not a substitute for measured book depth. The HYPE venue comparison exposes those layers beside the rate.
3. Liquidity and exit risk
A high rate often appears where capacity is weakest. The measured HYPE leg carried $179K of open interest, $17.7K of 24-hour volume and a $10,000 entry impact of 0.83%. Those numbers describe a market where the funding percentage can look large precisely because the available capacity is small.
Compare that with BTC across venues, where the calmer 6.6% setup had tens of millions in open interest and far smaller measured slippage. Capacity is part of the setup, not a footnote.
4. Interval and settlement mismatch
One venue may settle hourly while another uses four or eight hours. Raw percentages therefore represent different time exposure, and the two legs may update at different moments. A spread calculated without verified intervals can be wrong before any market movement occurs.
Normalize first, then retain each raw interval in the record. If an interval cannot be verified, the honest output is a gap rather than an annualized comparison.
5. Venue and collateral risk
Opposite market legs do not remove venue-specific risk. A degraded API, paused withdrawal path, collateral divergence or margin-rule change can affect only one side. The price hedge may remain conceptually balanced while the account cannot rebalance both legs on the same timeline.
PerpRadar therefore keeps freshness and venue health attached to each number. Stale data is not promoted as live, and missing depth is not represented as zero cost.
6. Timing and process risk
Two legs rarely reach their intended exposure at the exact same instant. Partial execution, delayed confirmation or a fast mark-price move can leave temporary directional exposure. Later, exits can face the same asymmetry in reverse.
A robust review starts with persistence, measured cost at size, capacity, interval proof and venue freshness. If one layer is unknown, the projected spread should be discounted or left unranked rather than filled with an assumption.
FAQ
- Is funding rate arbitrage risk-free?
- No. Opposite legs reduce directional exposure, but the funding spread can reverse, execution has costs, liquidity can disappear and one venue can degrade independently of the other.
- What is the biggest funding arbitrage risk?
- Usually persistence: the observed spread may narrow or flip before fees and slippage are recovered. One measured S pairing flipped direction 14 times within 24 hours.
- Why does market depth matter for funding capture?
- Funding accrues on notional, but entry and exit consume available book depth. Thin depth increases slippage and limits capacity, so the displayed rate may not be usable at the intended size.
- Do opposite legs remove venue risk?
- No. API degradation, collateral divergence, withdrawal constraints and margin-rule changes can affect one venue independently. The market hedge does not make the two venues operationally identical.