Perp funding rate APY: why 222% isn't what you earn
A perp funding rate APY is one funding interval — often a single hour — projected out to a year. The projection assumes the rate never changes and that entering and exiting at your size costs nothing. Both assumptions usually fail, and the gap between the headline number and what survives execution is where most funding trades quietly die.
Every number below is a live measurement from July 10, 2026, 15:58–16:08 UTC. The rates will have moved by the time you read this — which is the first lesson.
A 222% APY that lost 27 points in seven minutes
At 15:58 UTC the top of our funding table was a HYPE pairing: LONG leg on Bluefin, where funding printed −0.0241% per hour (−211% APY on that leg alone), SHORT leg on Extended at +0.0013% per hour. Net projection after fees and measured slippage: 222% APY.
At 16:05 UTC — the next render, seven minutes later — the same pairing showed 195%. No crash, no news. Bluefin printed a new hourly rate, −0.0209%, and 27 points of projected yield evaporated between two page loads.
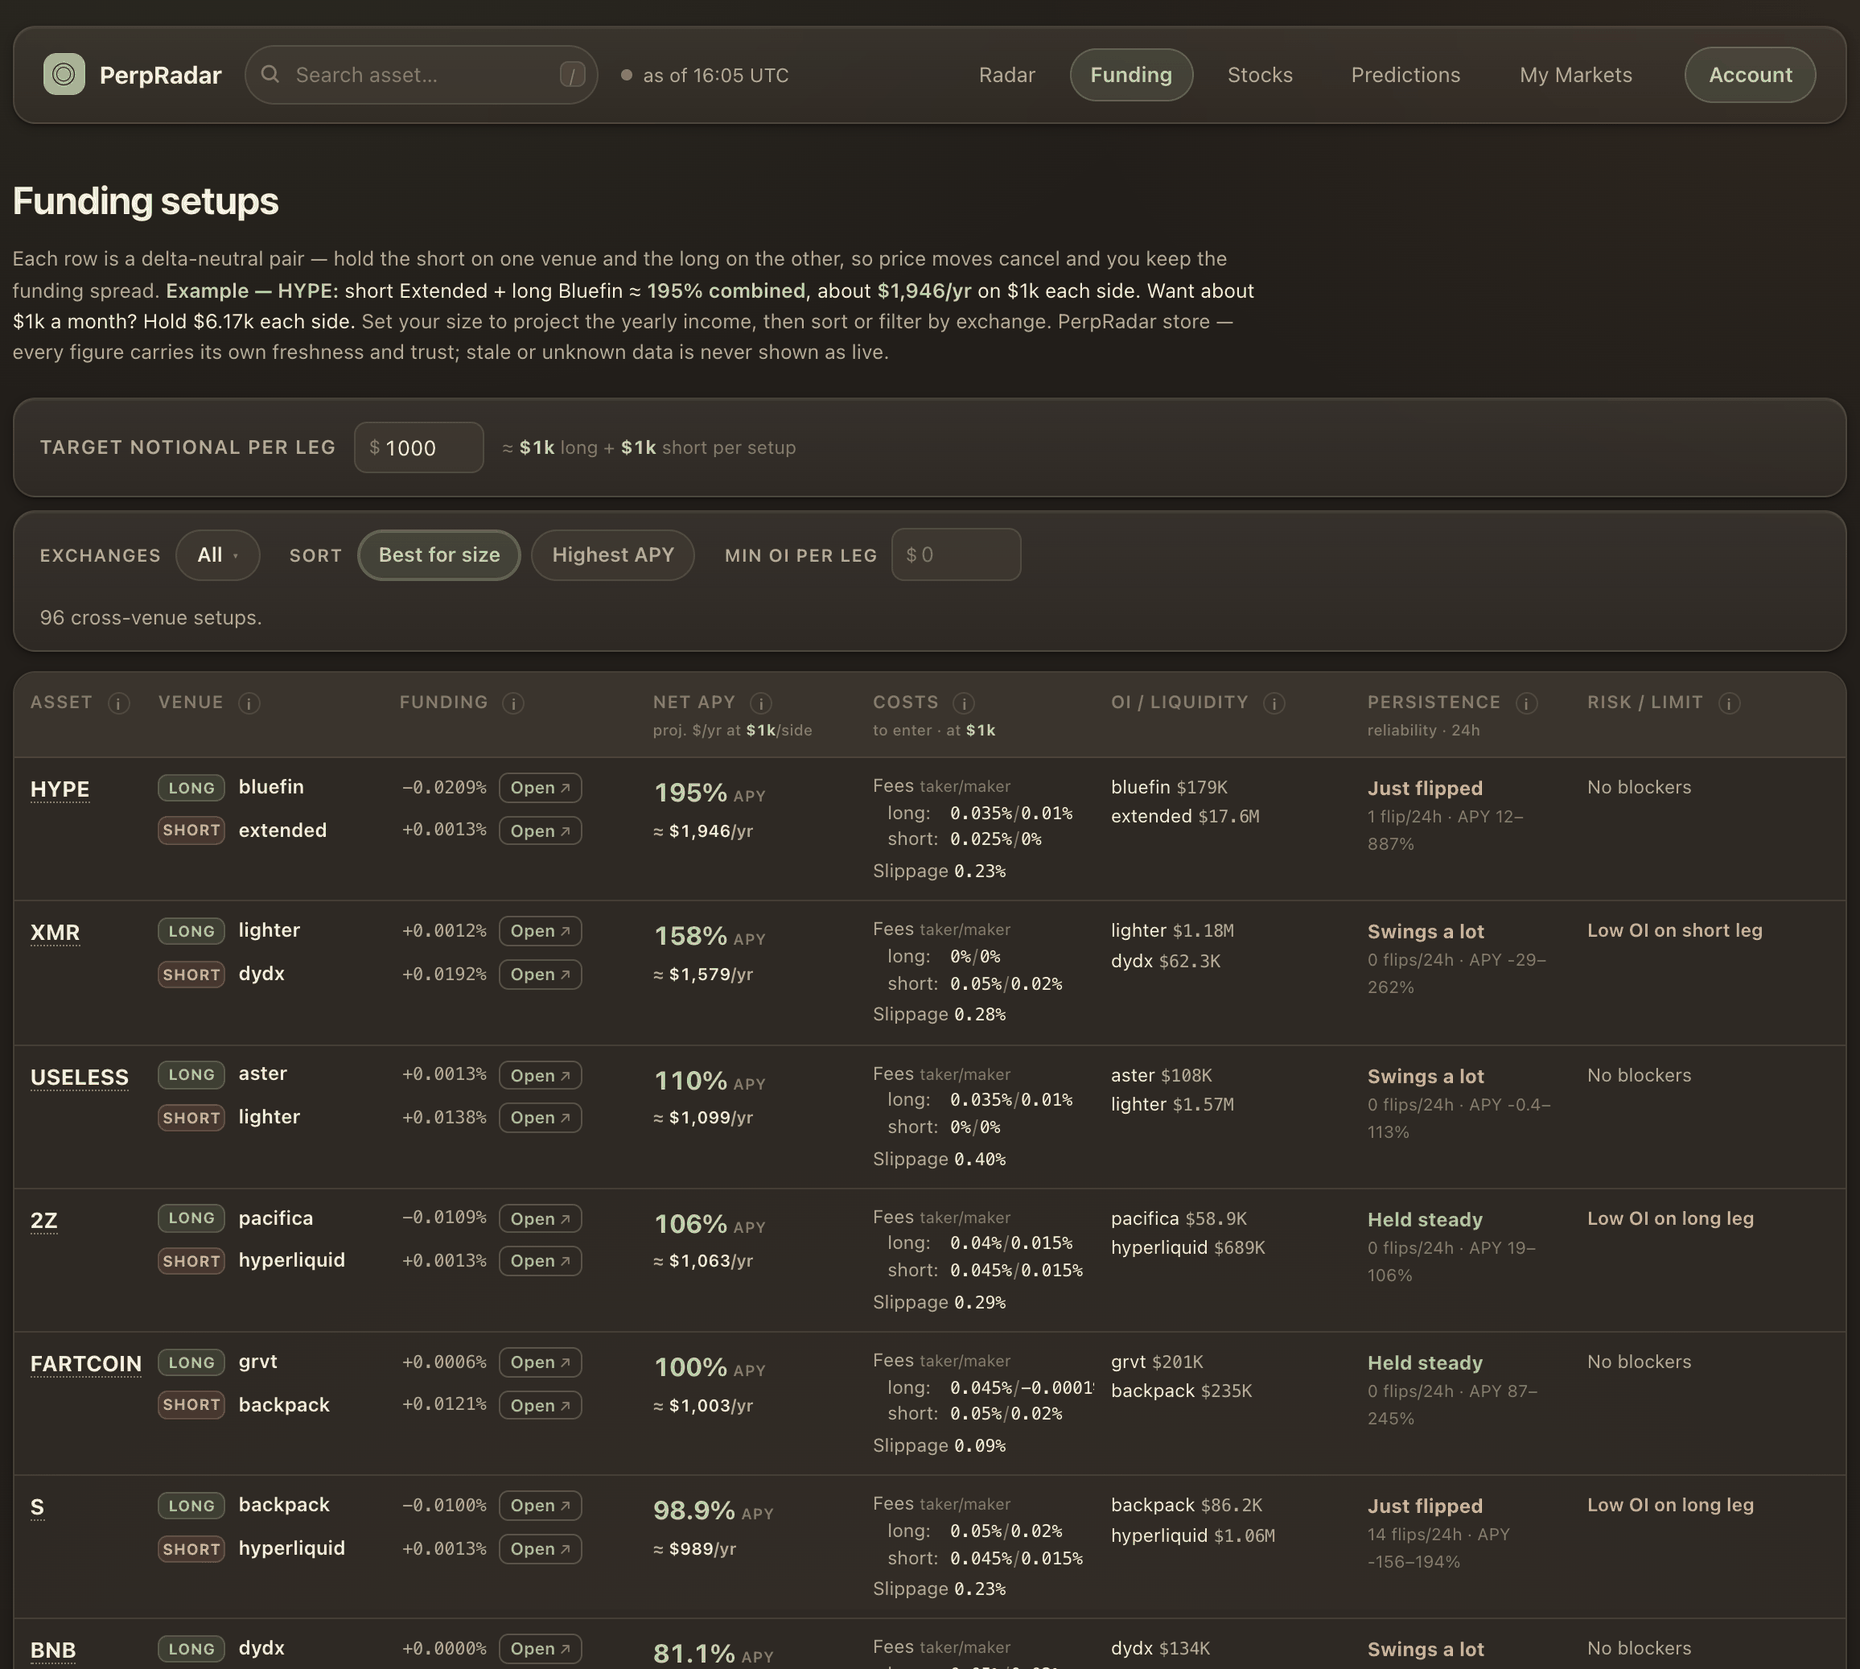
Here is what the paying leg looked like at that moment on the HYPE page: open interest $179K, 24-hour volume $17.7K, spread 1.66%, and a $10k market entry would move the price 0.83%.
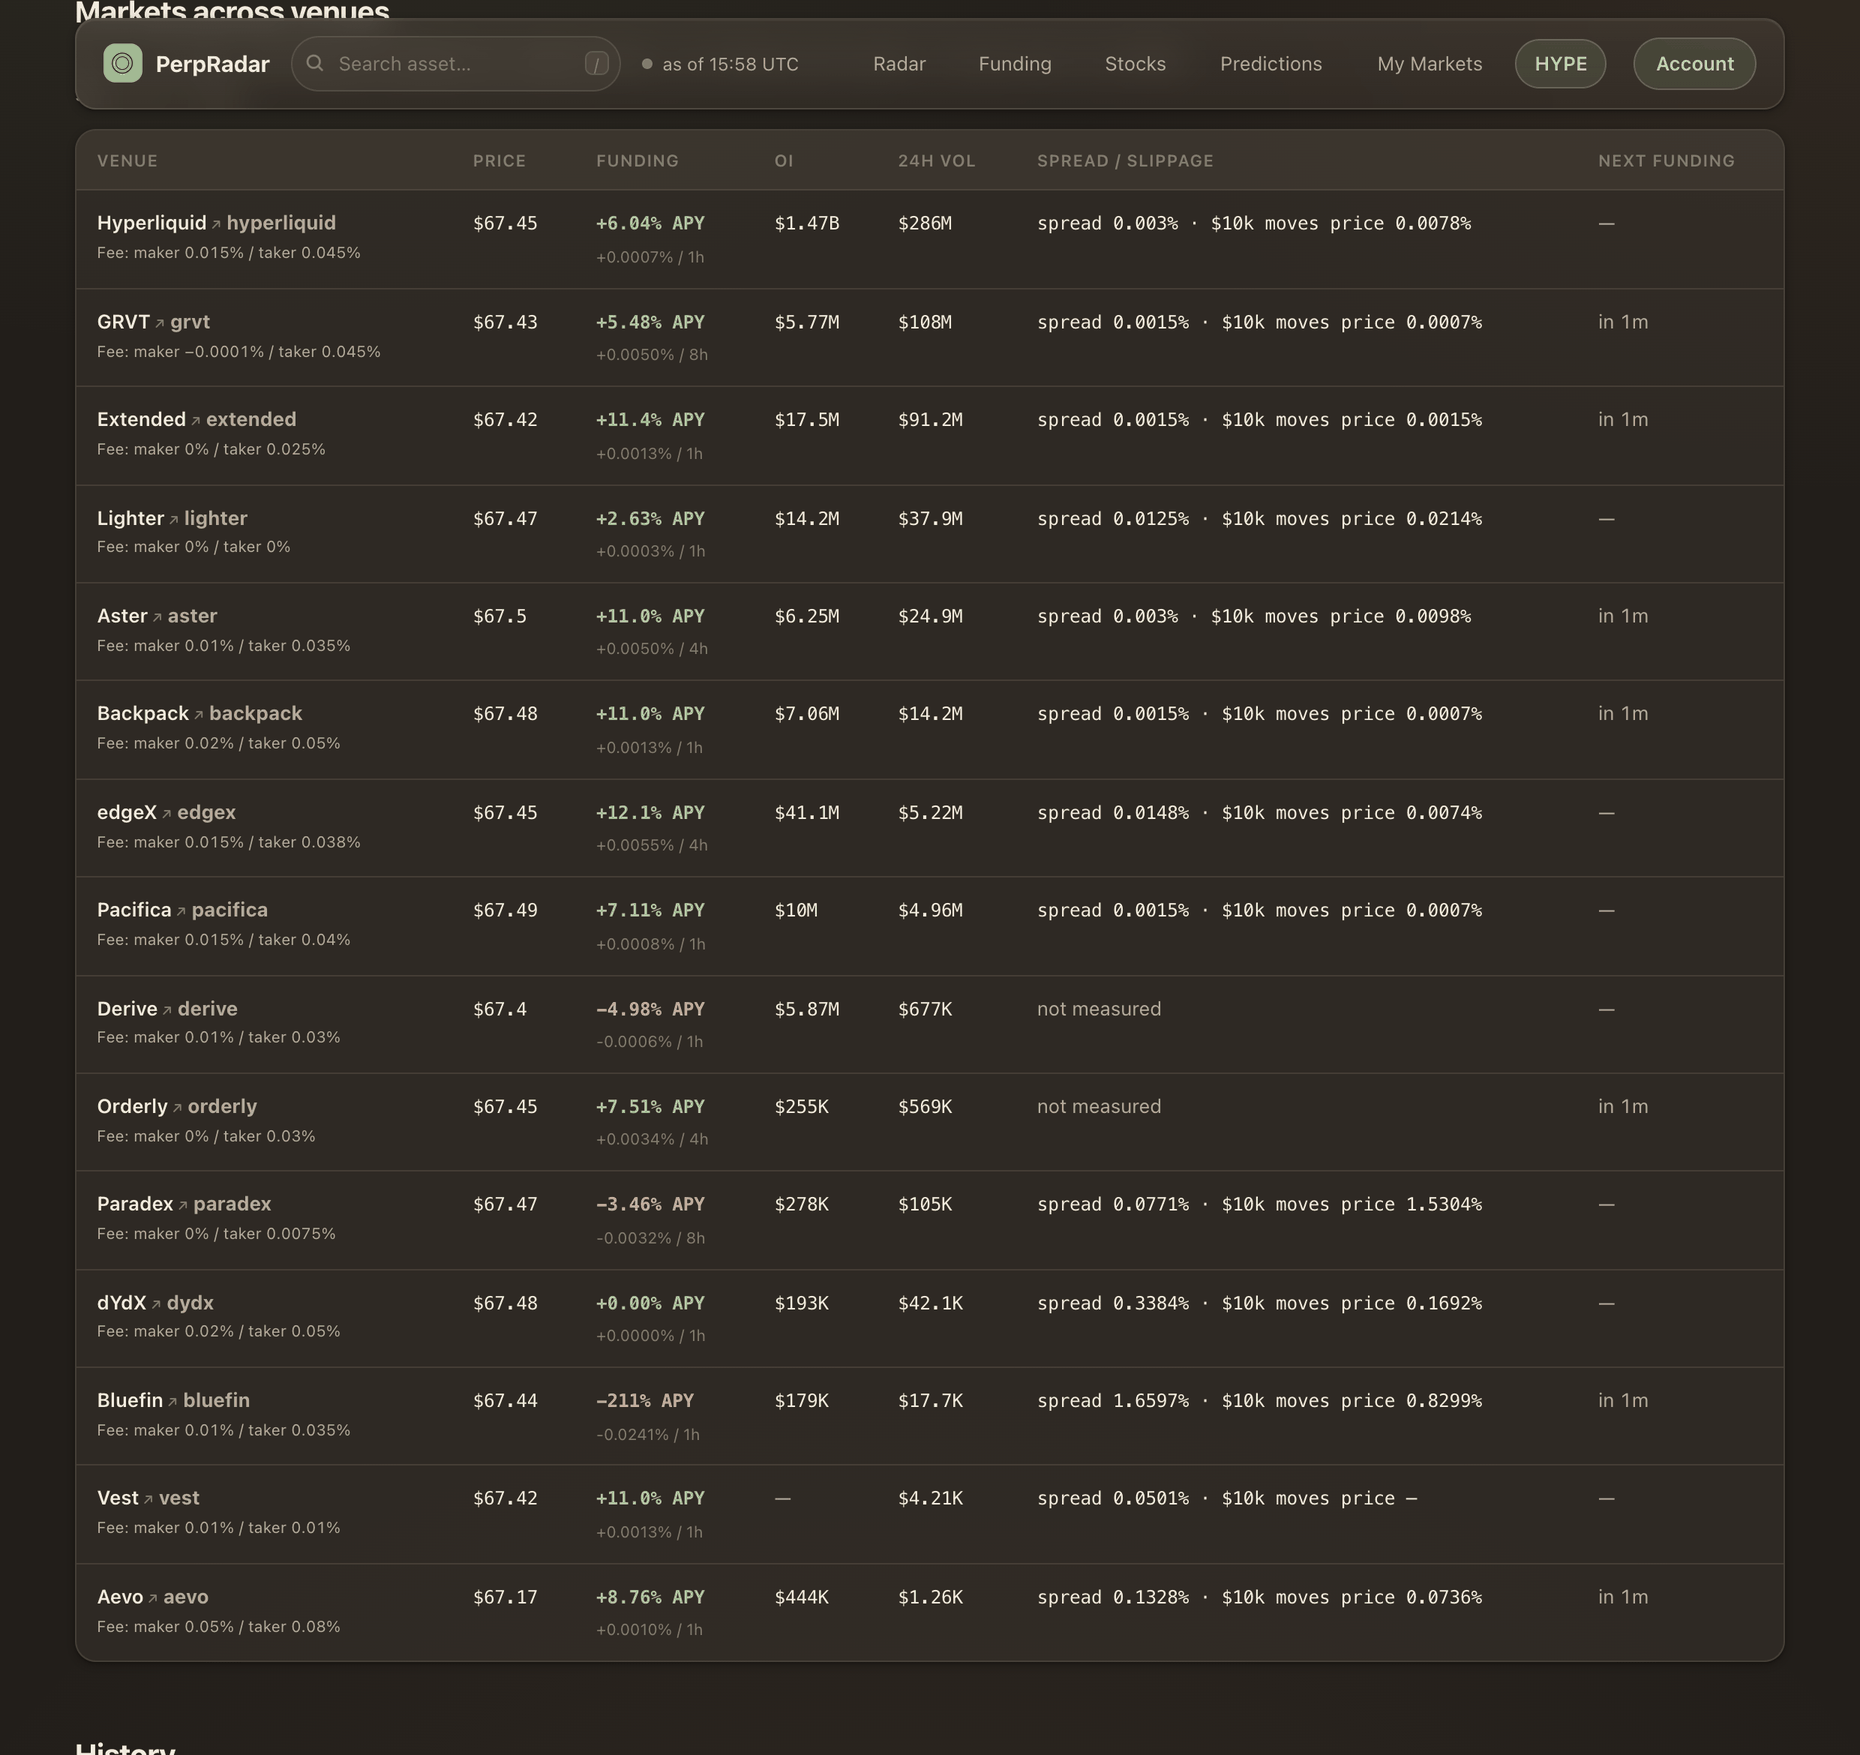
Do the arithmetic. At −0.0241% per hour, the leg accrues roughly 0.58% per day. Crossing a 1.66% spread on the way in and out costs about three days of that funding — if the rate holds for three days. Over the previous 24 hours, this pairing's annualized net had ranged from 12% to 887%.
What is a funding rate?
A funding rate is a periodic payment between the two sides of a perpetual futures market, designed to pull the perp's price back toward spot. Perps never expire, so funding is the only anchor: when the perp trades above spot, funding goes positive and the crowded side pays; below spot, it goes negative.
Direction comes before everything else:
- Positive funding → SHORT legs receive, LONG legs pay.
- Negative funding → LONG legs receive, SHORT legs pay.
Delta-neutral funding capture takes opposite legs on two venues and collects the difference. The projection on the screen assumes that difference persists and that both entries are free. The rest of this article is about those two assumptions.
What does the APY number actually mean?
On PerpRadar, “funding APY” is the screen label for a simple annualized projection: an hourly −0.0241% print becomes −211% (0.0241% × 24 × 365). Mathematically, that is closer to an APR-like annualized rate than a true compounded APY. A true APY would assume each funding payment is continually reinvested. We keep the familiar APY label, but it should be read as a projection, not promised compounded yield.
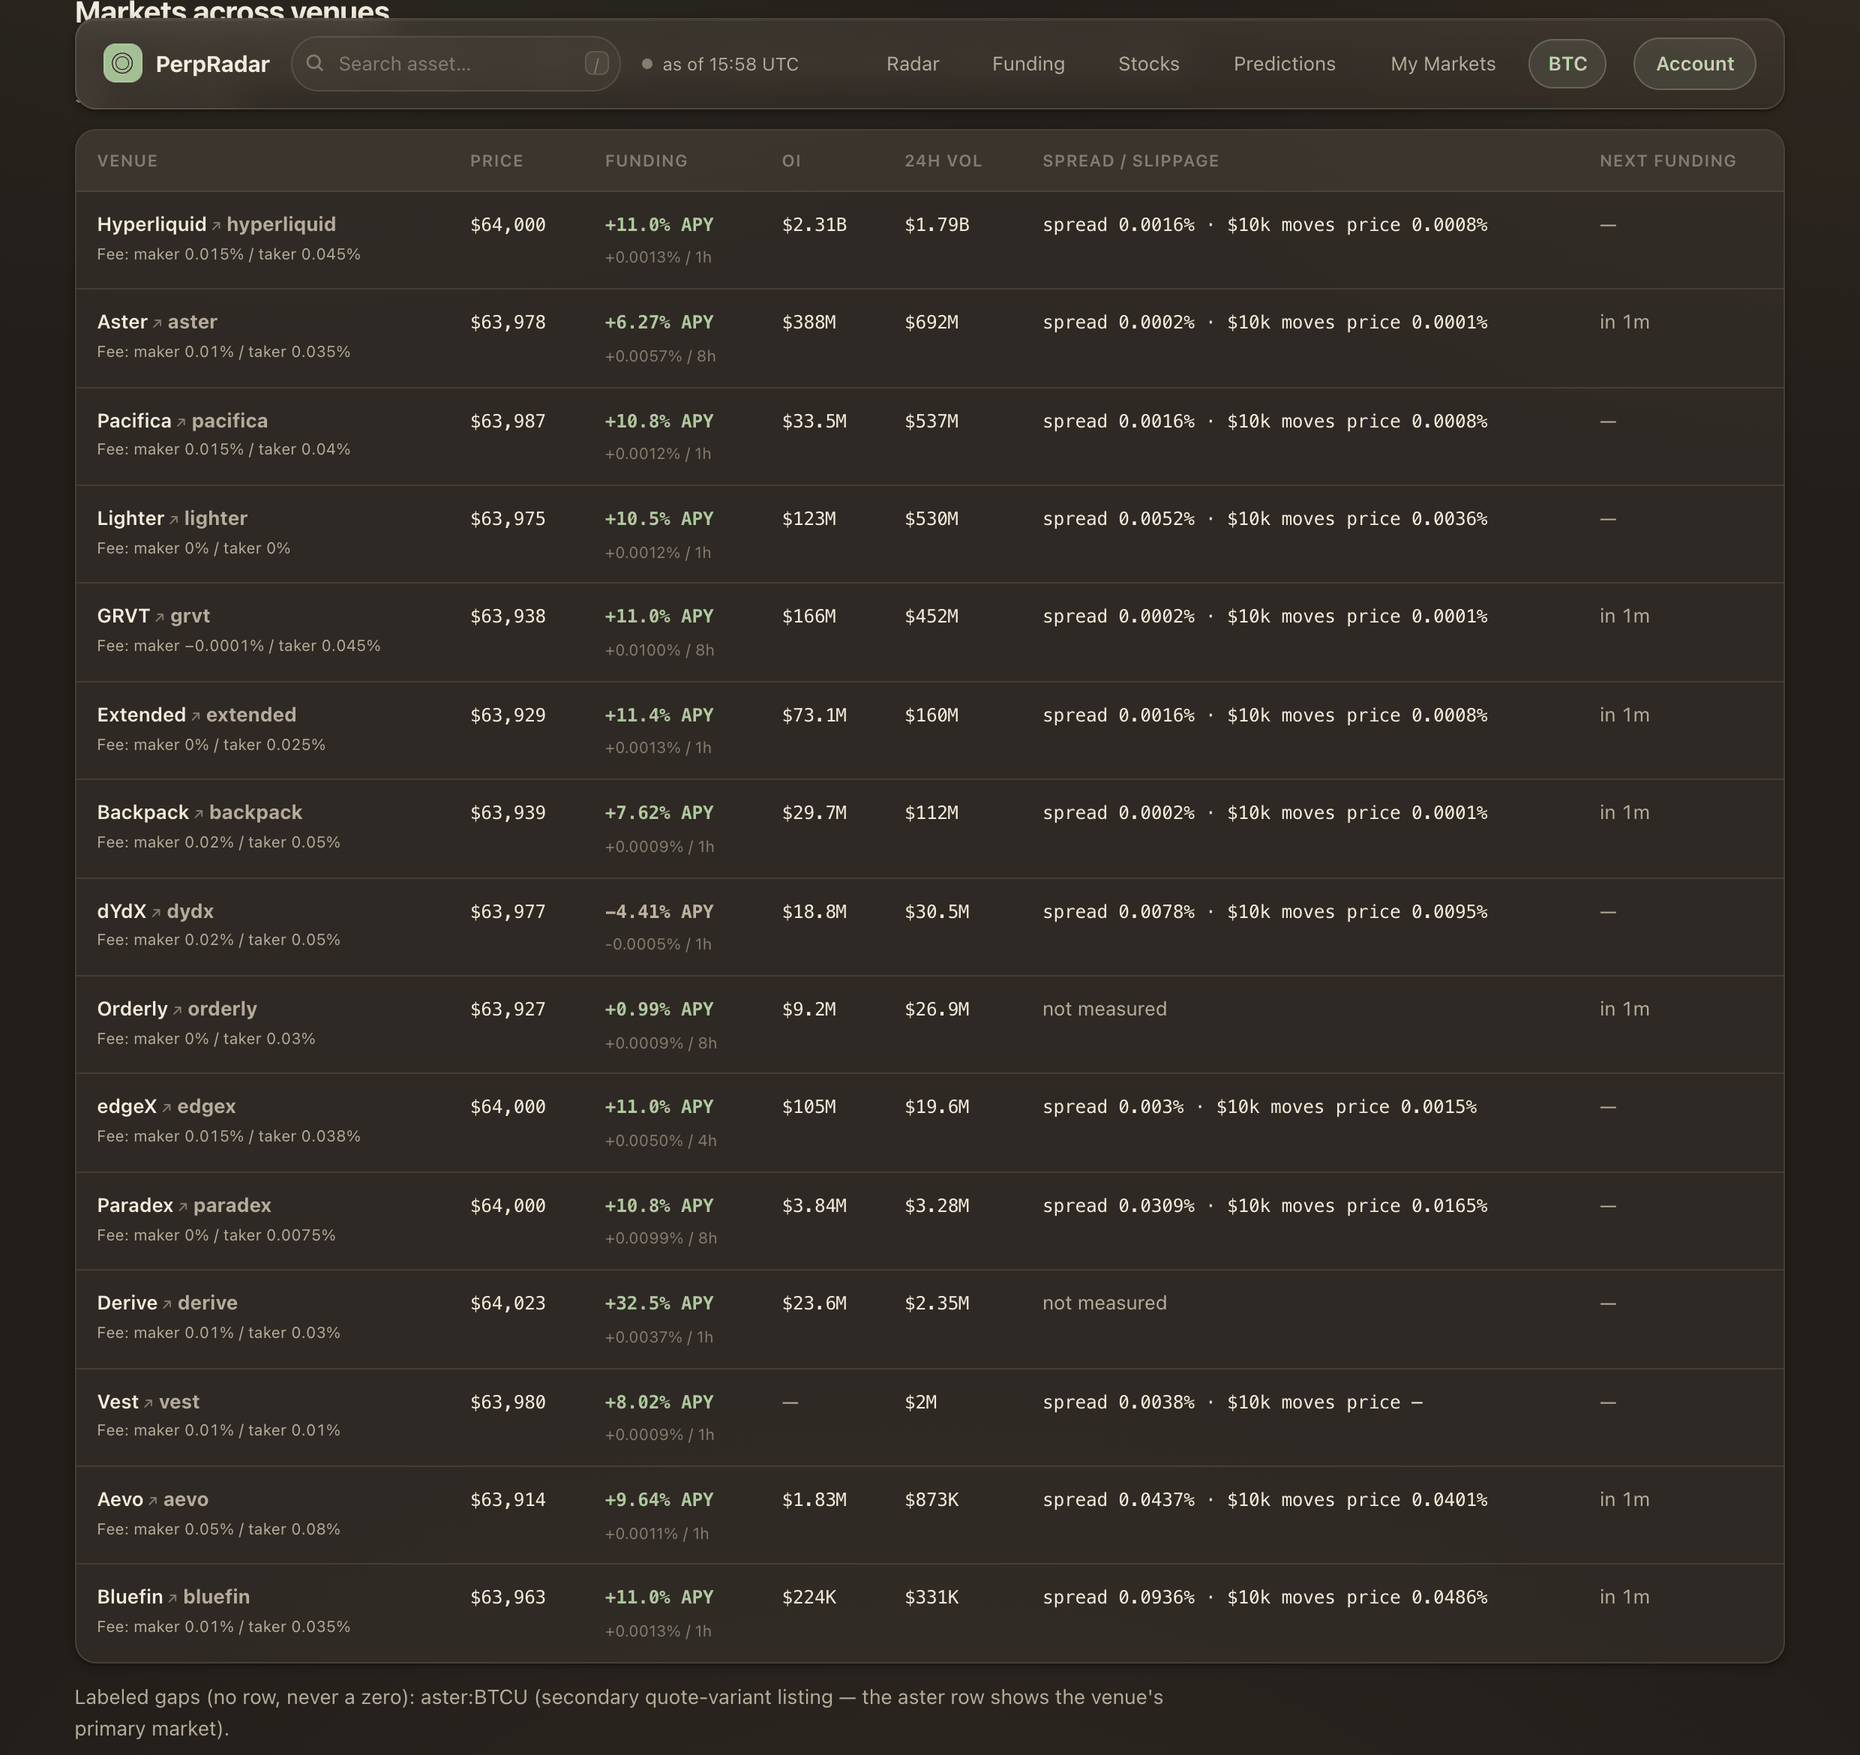
The subtlety is the interval. On the same BTC page that day, venues quoted funding per 1 hour (Hyperliquid, +0.0013%), per 4 hours (edgeX, +0.0050%), and per 8 hours (GRVT, +0.0100%; Paradex, +0.0099%). Raw prints across venues are not comparable until each is normalized by its own interval: +0.0100% per 8 hours is a lower rate than +0.0013% per hour, even though the print looks eight times bigger.
Why the biggest number is rarely the best trade
The same day, BTC printed an identical hourly rate — +0.0013% — on two venues. On Extended, that market carried $73.1M of open interest and a 0.0016% spread. On Bluefin: $224K of open interest and a 0.0936% spread, roughly 60× wider entry cost at the identical rate. The rate doesn't tell you where it can be taken; the book does.
Scale that to the extreme case above: the −211% HYPE leg lived in a market that traded $17.7K in a day. For comparison, BTC on Hyperliquid that afternoon: $2.31B open interest, $1.79B of daily volume, and a $10k entry moving the price 0.0008%.
What does persistence tell you?
A single print says nothing about tomorrow, so track the last 24 hours: how many times the net rate flipped sign, and the range it covered.
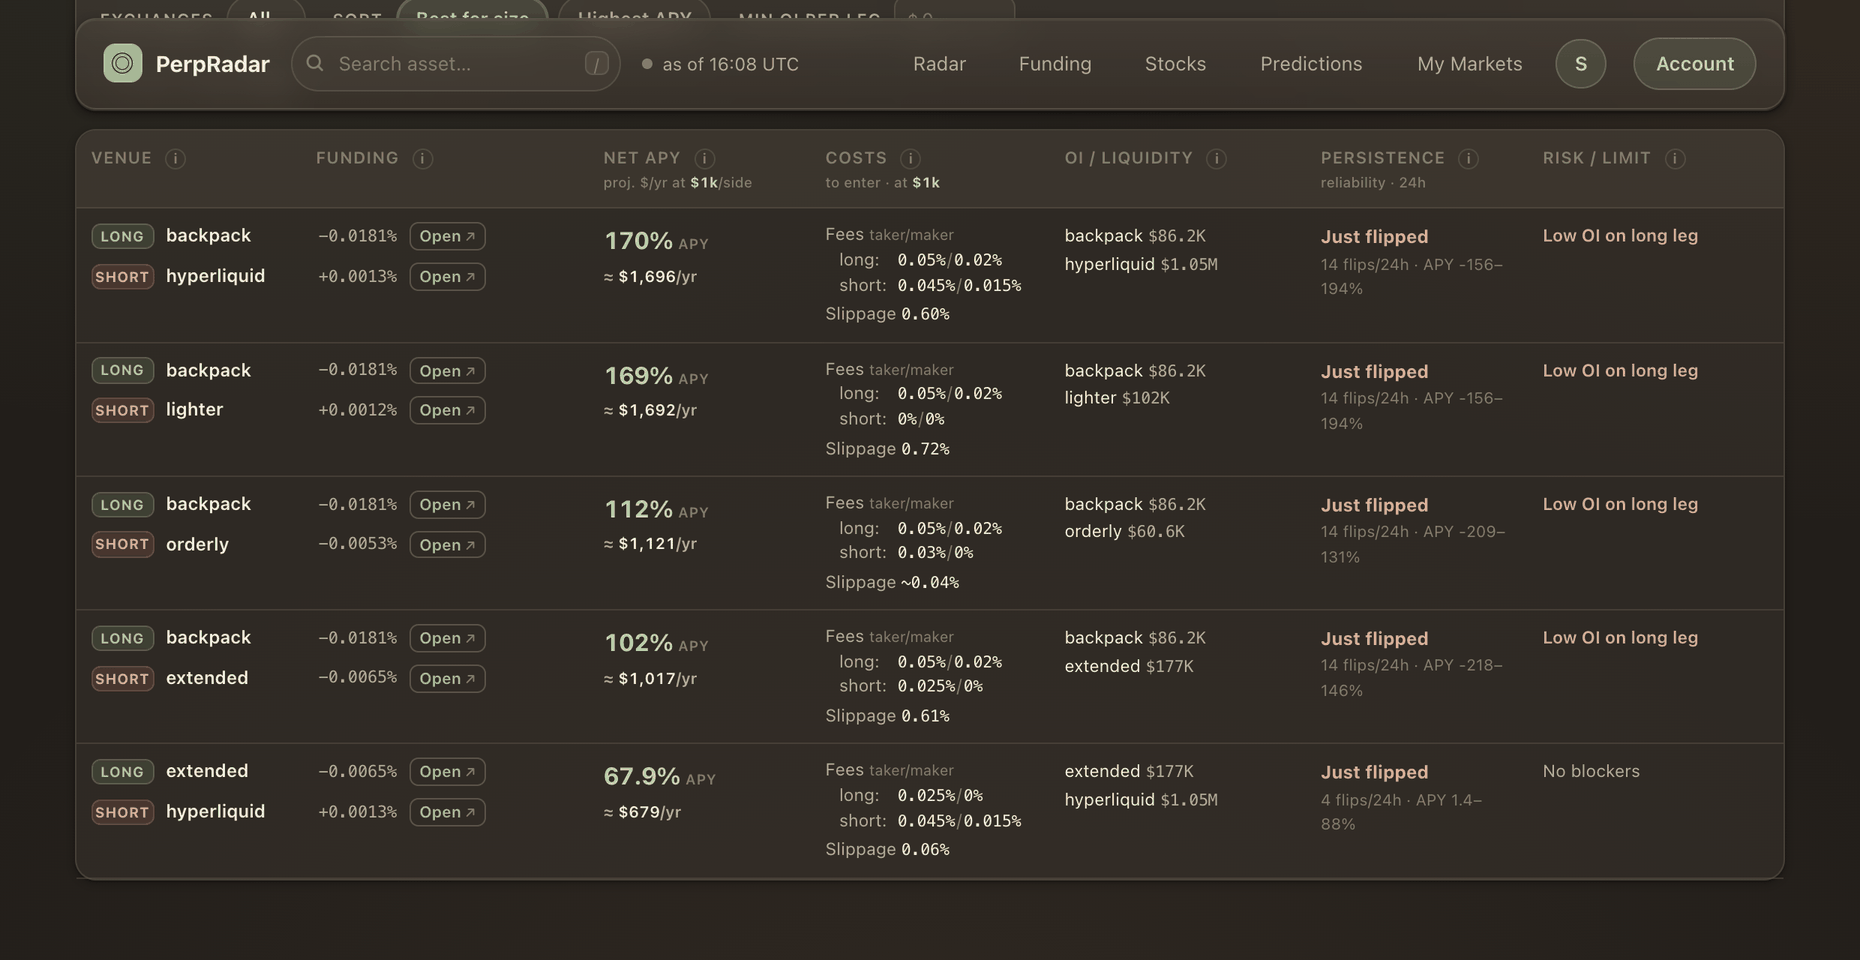
The cautionary case that day was S: a 98.9% APY projection — LONG Backpack at −0.0100% hourly, SHORT Hyperliquid at +0.0013% — with 14 sign flips in 24 hours and a net range from −156% to +194% APY. For a meaningful part of that day, the same pairing paid the other direction. The row also carried a flag: $86.2K open interest on the receiving leg.
Now the boring counterexample. BTC, LONG Pacifica at +0.0005% hourly, SHORT edgeX at +0.0013% (hourly-normalized): a 6.6% APY projection, zero flips in 24 hours, a 24h range of 0% to 6.6%, measured entry slippage at $1k of 0.00%, and $33.6M / $105M of open interest on the legs.
| Measured Jul 10, 2026 (UTC) | HYPE bluefin/extended | S backpack/hyperliquid | BTC pacifica/edgex |
|---|---|---|---|
| Net APY projection | 222% (15:58) → 195% (16:05) | 98.9% | 6.6% |
| 24h net range | 12% – 887% | −156% – +194% | 0% – 6.6% |
| Sign flips in 24h | 1 | 14 | 0 |
| Smaller leg: open interest | $179K (Bluefin) | $86.2K (Backpack) | $33.6M (Pacifica) |
| That leg: 24h volume | $17.7K | $220K | $537M |
| That leg: spread | 1.66% | 0.39% | 0.0016% |
| Entry slippage at $1k | 0.23% | 0.23% | 0.00% |
Which of the three projections has a chance of resembling what an account actually books after a week? The 6.6% one — because it is the only row where every layer under the number holds.
How to check a high funding APY yourself
Three steps, no special tooling required:
- Find the raw print and its interval on the venue itself, not the annualized number. Normalize: rate × intervals-per-day × 365. Confirm which side receives.
- Read the book at your size, on both legs: the spread plus the levels your entry would walk through. Compare that round-trip cost with days of funding income, not with the APY.
- Pull 24 hours of funding history — venue APIs publish it. Count sign flips and look at the range. One print is an observation; a day of prints is evidence.
Sources and methodology
PerpRadar recorded public venue API observations and captured book-depth snapshots at the stated size. Each funding print was normalized using that venue's own interval; fees, spread, slippage, open interest and volume came from the same saved product renders shown above. The screenshots and timestamps make these historical observations auditable without pretending they are still live.
For a reproducible example, Hyperliquid's official perpetuals API documentation exposes current funding, open interest and historical funding rates. Other venue adapters follow the same rule: use the venue's documented raw value and interval, never infer a missing interval.
About the author. Max Simashkin builds PerpRadar and maintains the market-data measurement and venue-adapter work behind this analysis. Questions or corrections can be sent through the public profile linked in the byline.
What PerpRadar measures
PerpRadar records perp-DEX markets — books walked at the size you type, funding on verified intervals, open interest, volume, and a freshness stamp on every figure — across 19 venues and 2,634 markets (as of August 13, 2026). On the funding table, every pairing carries the layers from this article: net APY after fees and measured slippage, per-leg raw rates with their intervals, the smaller leg's open interest, and 24h persistence — flips and range. Numbers that can't be measured are labeled as gaps, not guessed.
FAQ
- What does a high funding APY actually mean?
- It is the latest funding print, annualized. A −0.0241% hourly print displays as −211% APY. The figure holds only if the rate stays identical all year; on July 10 the top pairing moved 27 APY points between renders seven minutes apart.
- Does positive funding mean I receive it?
- Only on the SHORT side. Positive funding: shorts receive, longs pay; negative funding reverses it. Direction is the first thing to check — the size of the number is irrelevant if it flows against you.
- Is delta-neutral funding capture risk-free?
- No. Fees and slippage hit both legs, the rate can flip mid-trade (S flipped 14 times in one day), thin books make exits worse than entries, and every venue has its own interval and mechanics. The direction hedge removes price exposure, not execution cost.
- Why do two venues show a different APY for the same-looking rate?
- Because funding intervals differ — 1h, 4h and 8h across the venues we measure. +0.0100% per 8 hours is a lower rate than +0.0013% per hour. Normalize per interval before comparing.
- How fast do funding APYs change?
- Between consecutive renders — minutes apart — the July 10 top pairing went from 222% to 195% APY. Its 24-hour range was 12% to 887%.